Code
library(tidyverse)library(tidyverse)The Data sets being used:
BOOKS <- read.csv("goodreads_Top100_YoungAdultFiction1.csv")
MOVIES <- read.csv("Animation_Movies.csv")Figure 1
# a graph that shows the relationship between ordered data clearly and does not imply an ordering where there is none.Figure 2
# a graph that messes up the relationship between ordered data and unordered data. The relationship of the order is confusing and possibly relationship are implied that don't exist.#fig 3
fig_3 <- ggplot(BOOKS, aes(pages))+ geom_histogram(binwidth = 20, color="blue", fill="blue")
#Style
fig_3_titles <- labs(title = "Figure 1: Number of Pages for Top 100 Young Adult Books",
caption = "This graph shows the number of pages of the most popular young adult books to within 20 pages.")
fig_3_theme <- theme(panel.background=element_rect(fill="white"),
plot.caption = element_text(hjust = 0.5))
#Showing figure 4
fig_3 <- fig_3 + fig_3_titles + fig_3_theme
print(fig_3)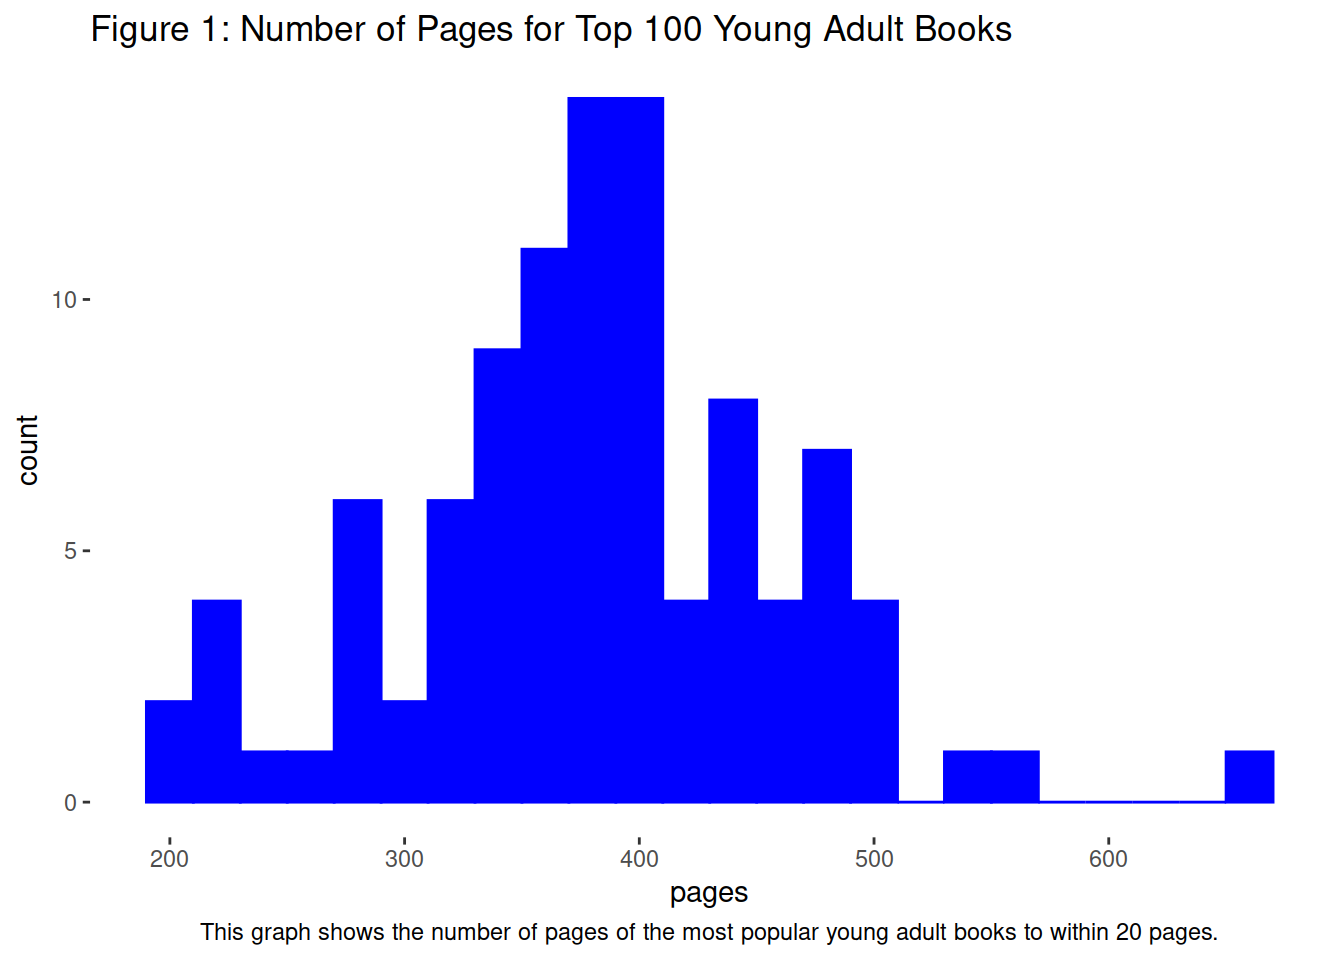
#fig 4
fig_4 <- ggplot(BOOKS, aes(pages))+ geom_histogram(binwidth = .5, color="red", fill="red")

#Style
fig_4_titles <- labs(title = "Figure 2: Number of Pages for Top 100 Young Adults Books",
                     caption = "This uses bin sizes of half a page. The data doesn't even measure book length to half pages.")
fig_4_theme <- theme(panel.background=element_rect(fill="white"),
                     plot.caption = element_text(hjust = 0.5))

#Showing figure 4
fig_4 <- fig_4 + fig_4_titles + fig_4_theme

print(fig_4)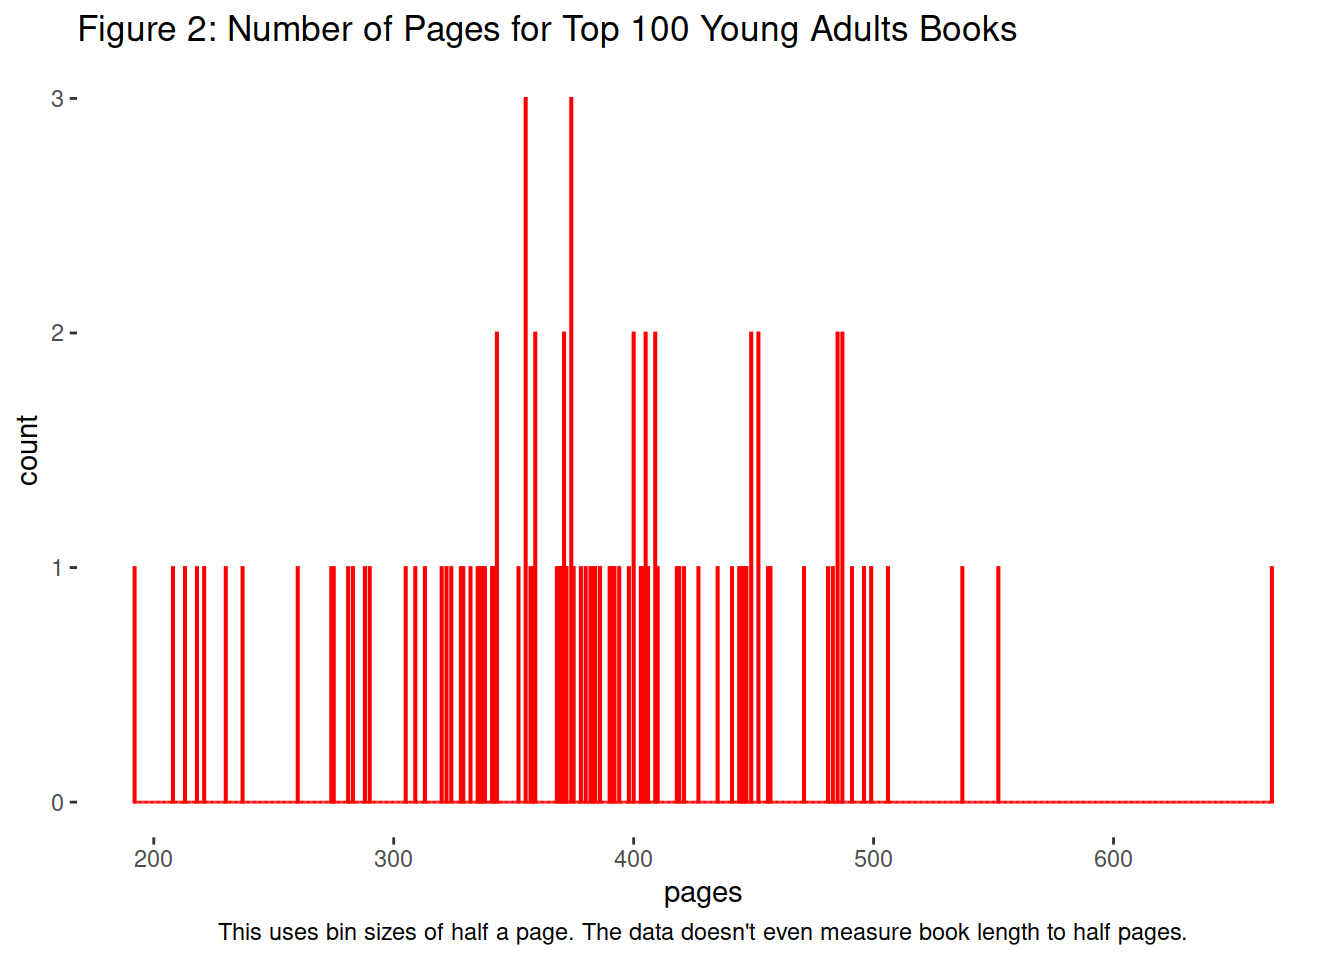
Figure 5
# a graph that uses a two or more channels to encode two or more attributes while maintaining separability.
MOVIES_3 <- MOVIES %>%
  filter(grepl("Pixar", production_companies)) %>%
  filter(runtime > 40) %>%
  filter(runtime < 140) %>%
  filter(budget > 0)

#filter these down to something interesting. only a couple of movies or only movies from a certain genre or country

ggplot(MOVIES_3, aes(x = reorder(title, +budget), y = runtime, fill = budget)) +
  geom_bar(stat = "identity") +
  coord_flip() +
  labs(title = "Pixar Movies",
       x = "Movies",
       y = "Runtime (minutes)") +
  geom_text(aes(label =  budget/1e6), hjust = +1, color = "lightyellow") +
  theme(panel.background = element_rect(fill = "grey"),
        panel.grid = element_blank(),
        axis.text.x = element_text(angle = 90, hjust = 0),
        plot.title = element_text(hjust = 0.1))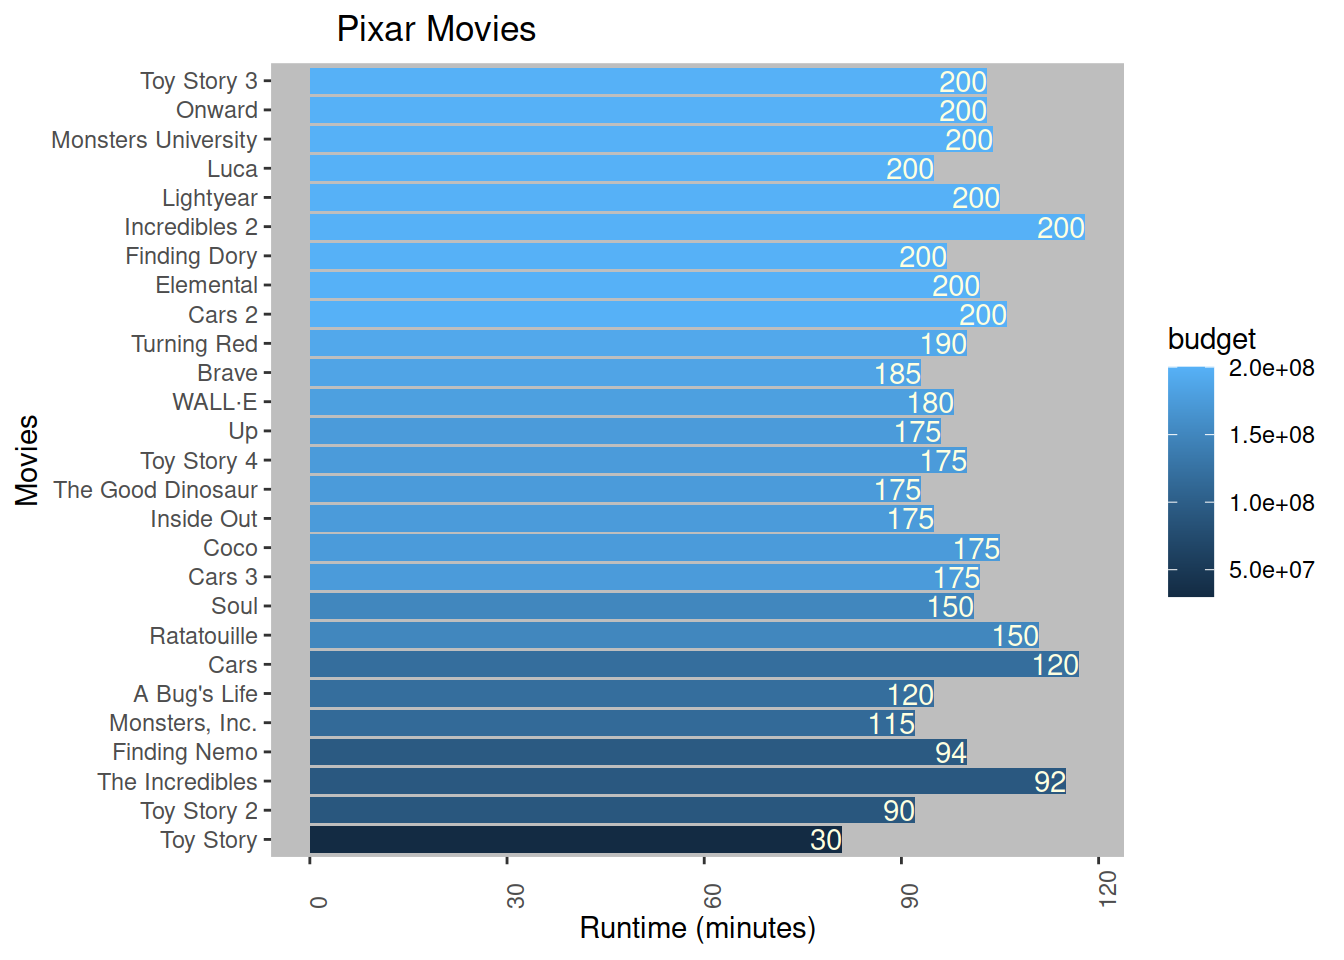
Figure 6
# a graph that uses a two or more channels to encode two or more attributes while and confuses separability.

ggplot(MOVIES_3, aes(x = title, y = runtime, fill = budget)) +
  geom_bar(stat = "identity") +
  coord_flip() +
  labs(title = "Pixar Movies",
       x = "Movies",
       y = "runtime") +
  theme(axis.text.x = element_text(angle = 90, hjust = 1),
        plot.title = element_text(hjust = 0.1))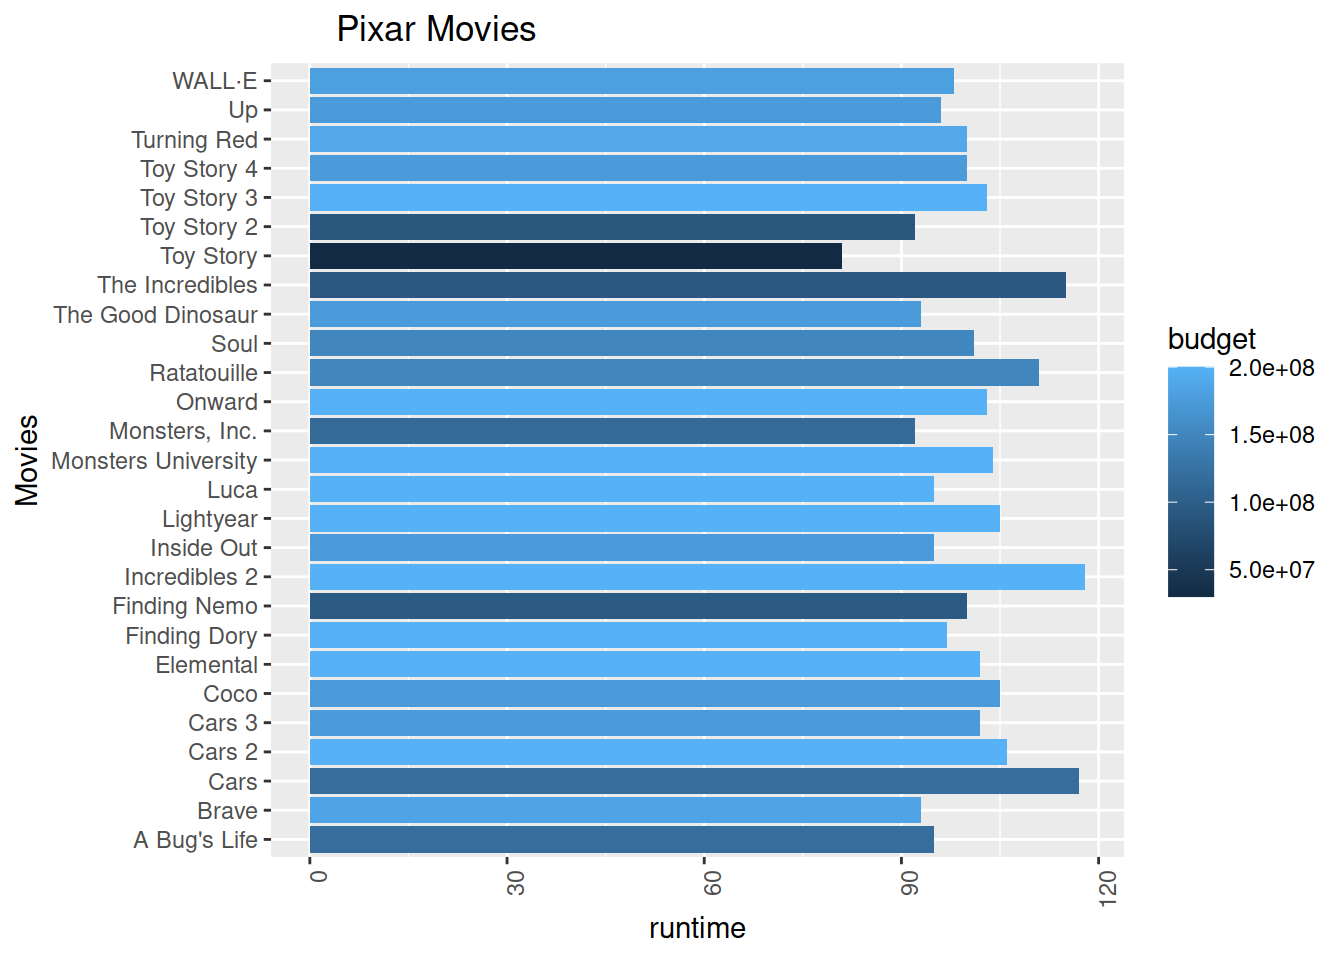
Figure 7
# a graph where popout is usedFigure 8
# a graph where popout is not used